
Attendance and task analytics for the whole team
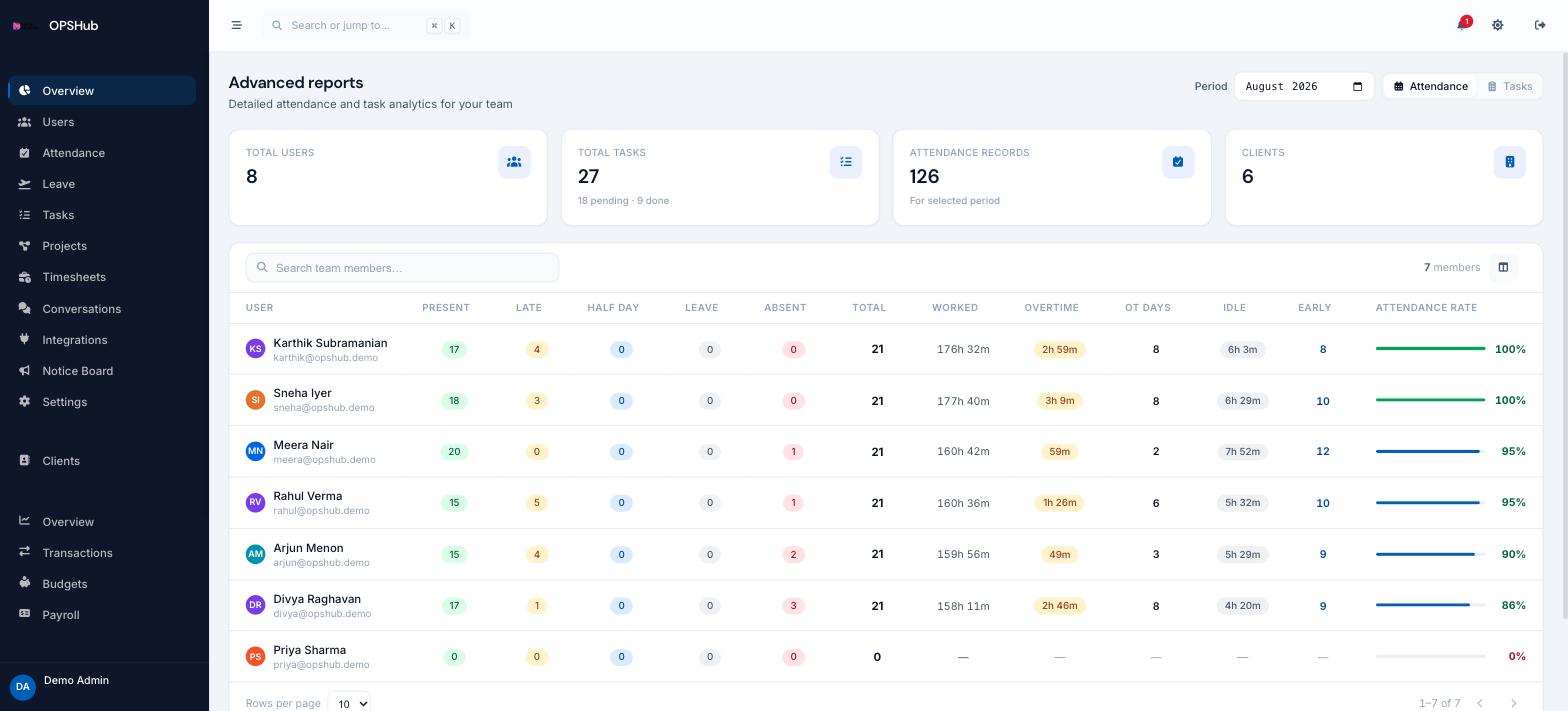
One screen answers the questions that usually take a morning: who is consistently late, where overtime is accumulating, whose attendance rate slipped this month, and how much work actually closed.
What you get
Every point below is live in OpsHub today. Nothing here is a roadmap item.
- Present, late, half-day, leave and absent counts per employee
- Worked hours, overtime, overtime days, idle time and early-outs
- Attendance rate per person as a comparable percentage
- Switch the same period between attendance and task analytics
- Choose your columns and search the team; pick any month
Questions about reports & analytics
Can I report on a past month?
Yes. The period selector takes any month and the whole page - tiles and table - recalculates for it.
Can I change which columns show?
Yes, columns are selectable, so you can cut the table down to the handful of metrics you review each month.
Is task reporting included?
Yes. The same screen toggles between attendance analytics and task analytics for the selected period.
Works with
OpsHub modules share one workspace and one set of records - these are the ones reports & analytics touches most.
See reports & analytics on your workflow.
Book a demo and we will map it to how your team already works - or open the live demo workspace right now.